Analysis of the Epidemic’s Spread and Change via Public Transportation based on Close Contact Tracing Data
We crawled data from this website.
We used Gephi to calculate some network indicators including degree, centrality, modularity and so on.
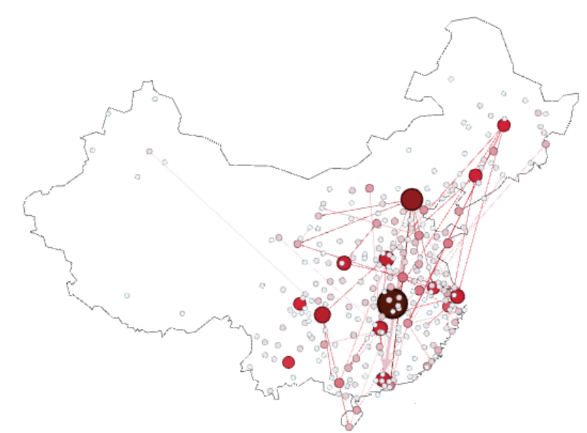
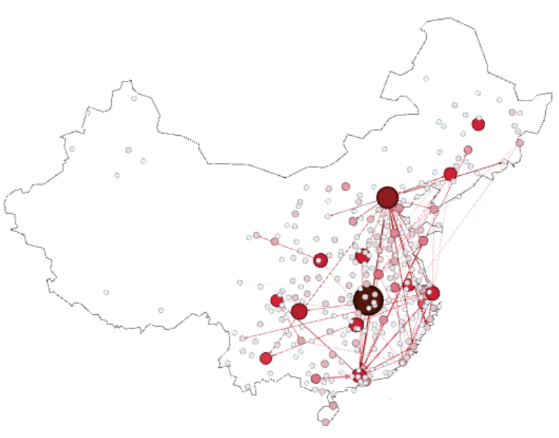
We realized visualization with Gephi as below.
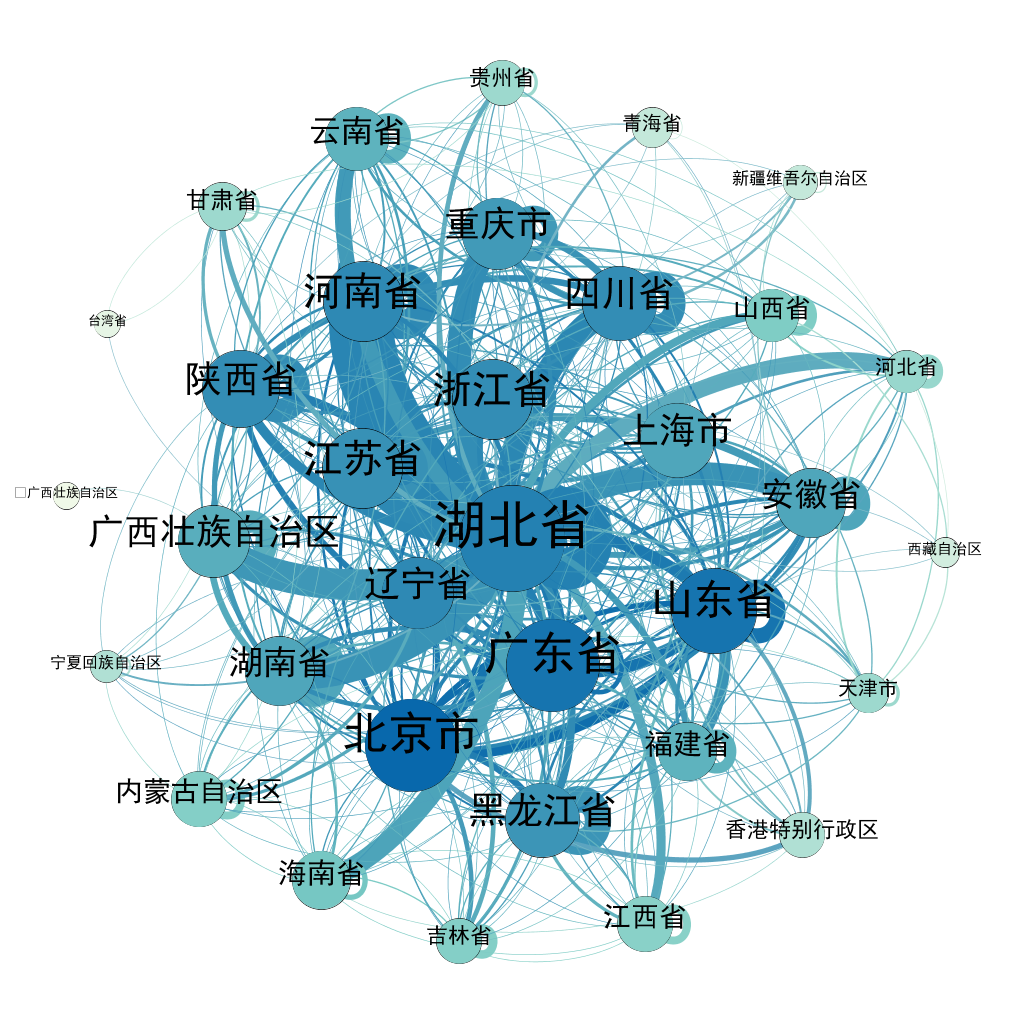
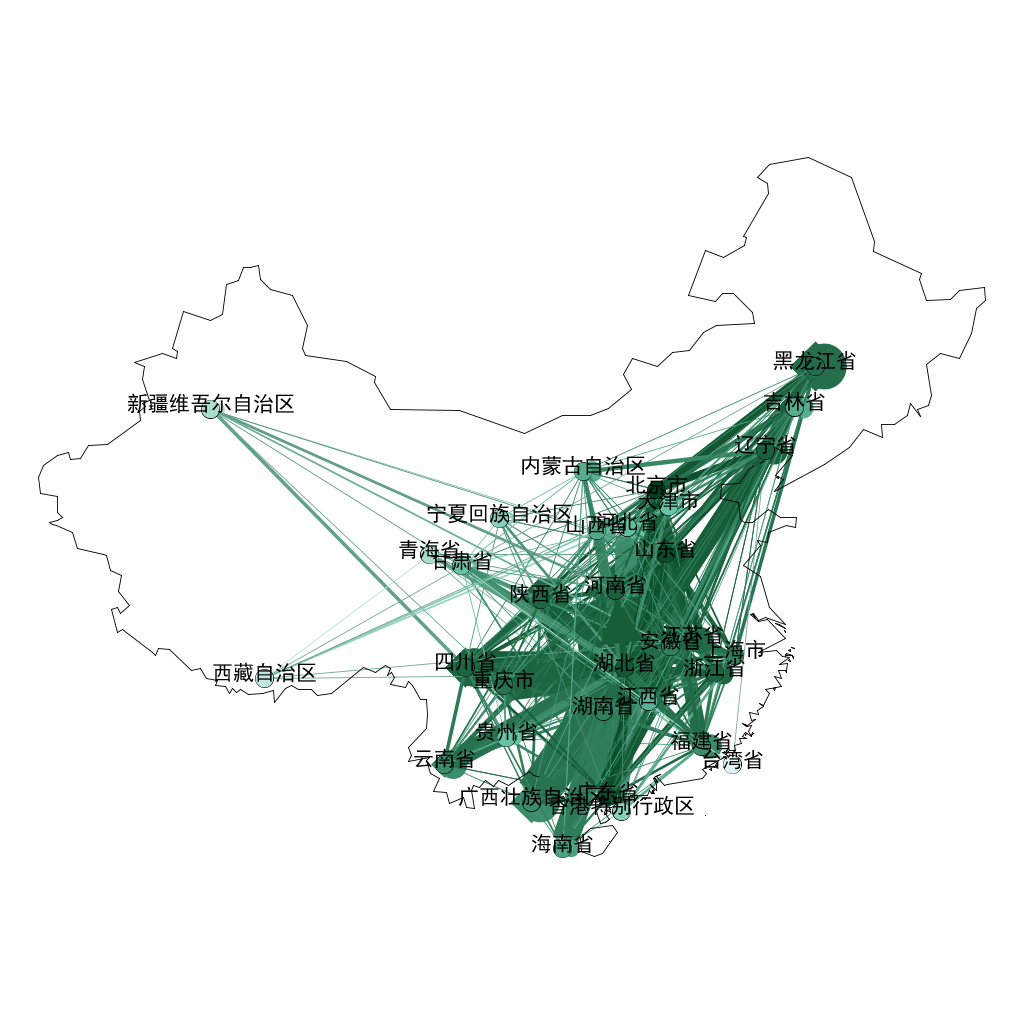
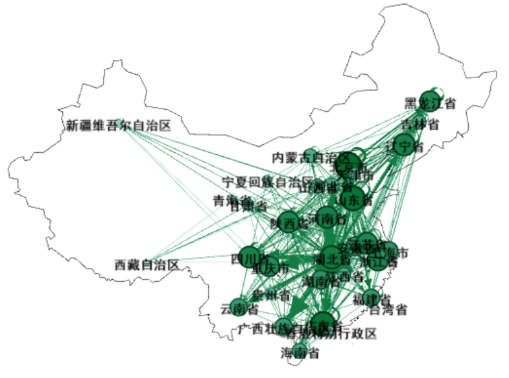
Among China (province as unit)
- Fruchterman Reingold layout
- Atlas layout
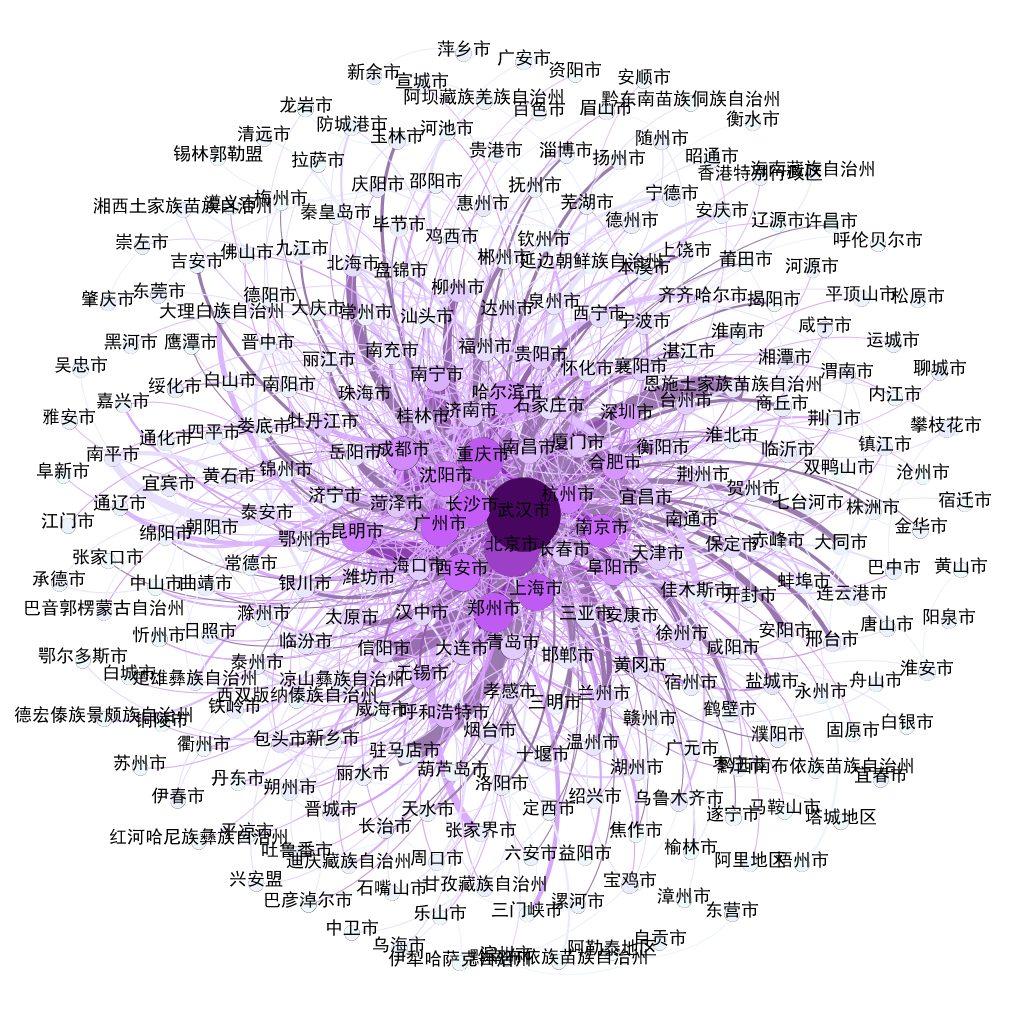
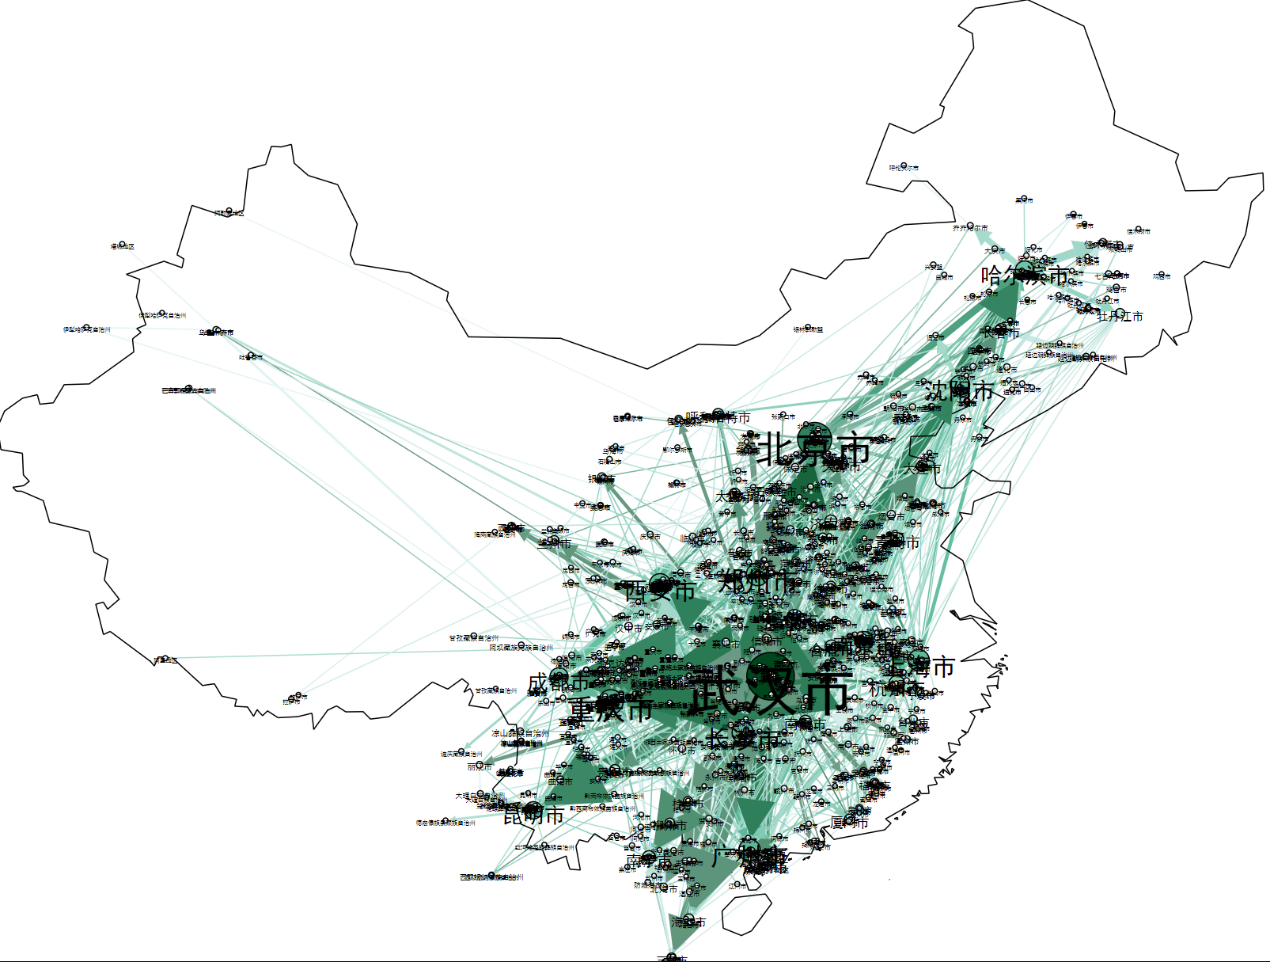
Among China (city as unit)
- Fruchterman Reingold layout
- Atlas layout
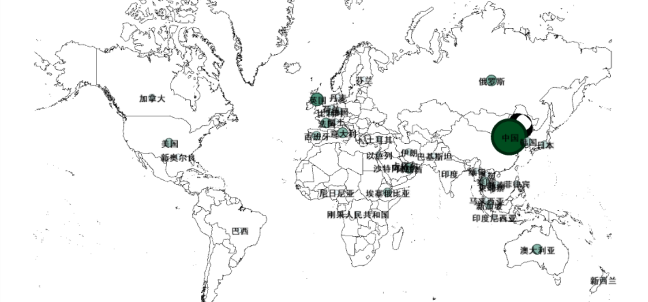
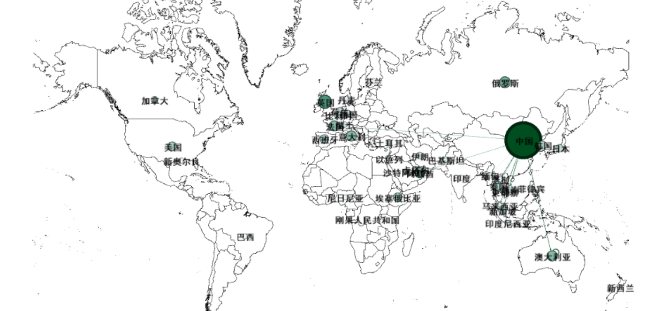
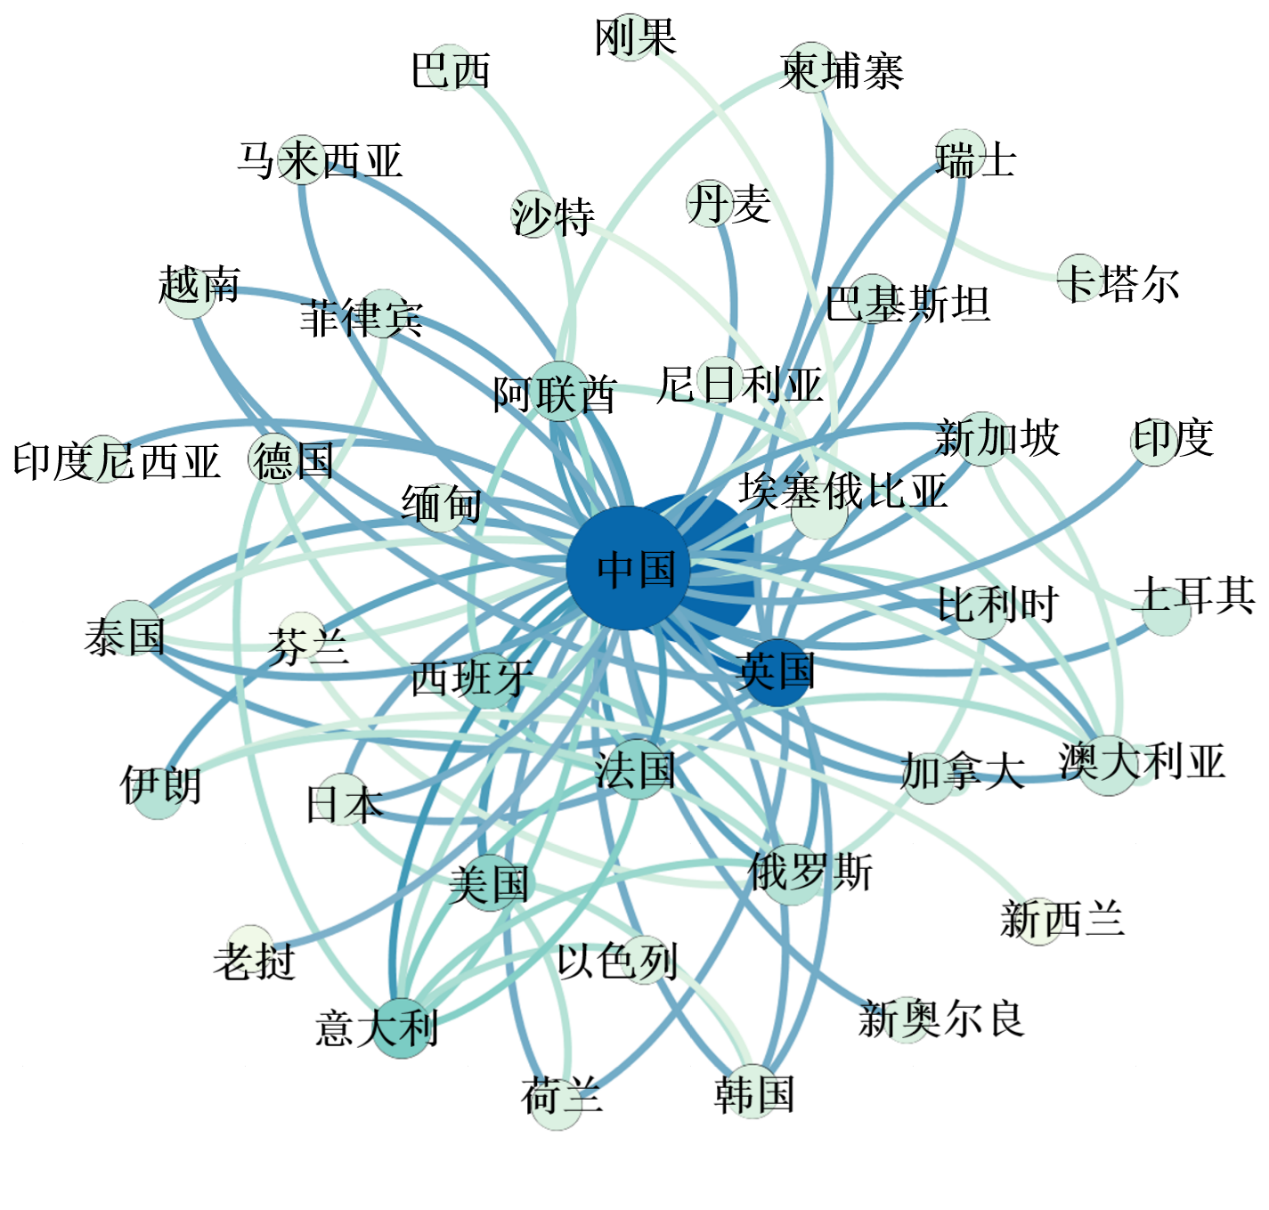
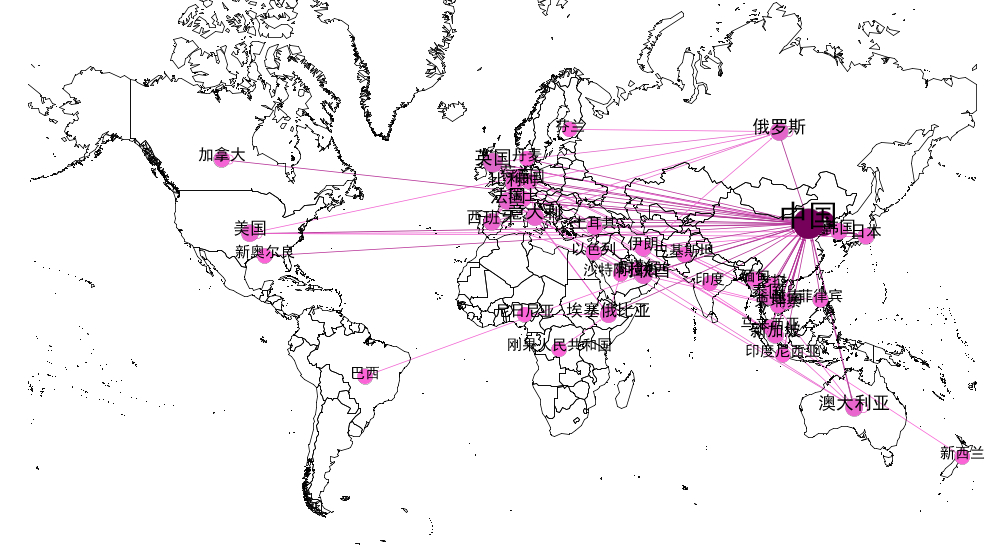
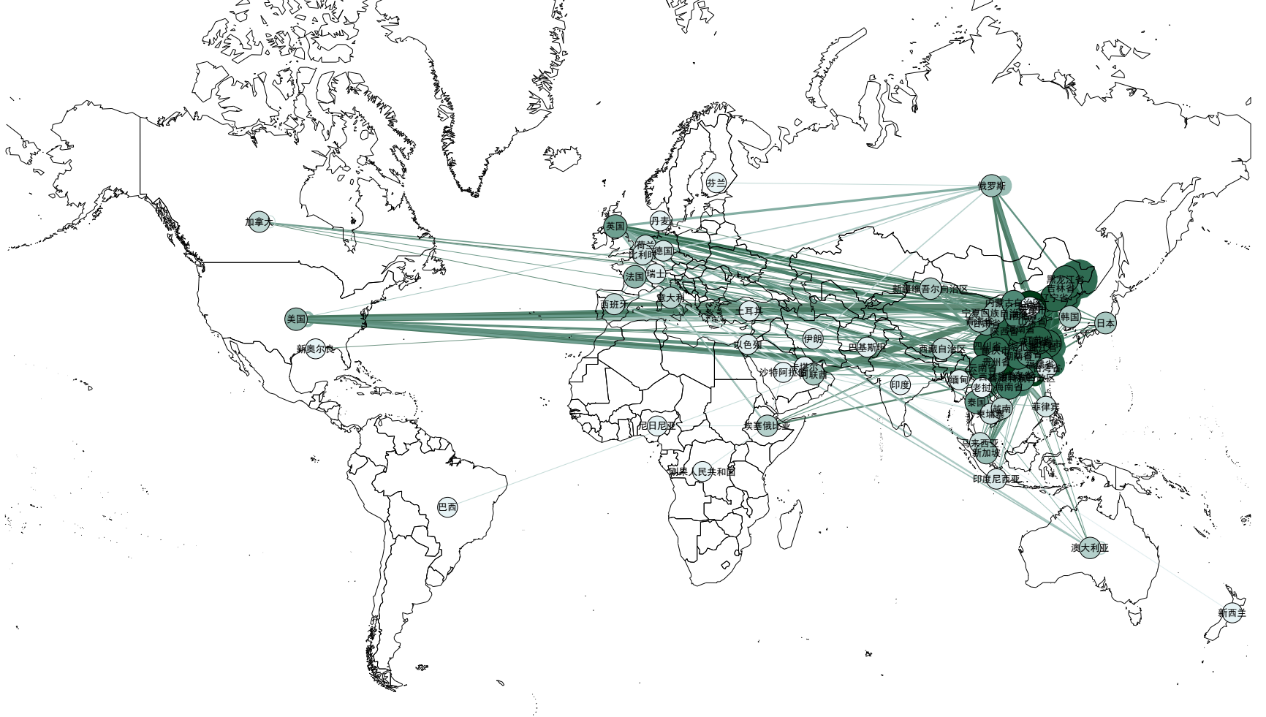
Whole world (country as unit)
- Fruchterman Reingold layout
- Atlas layout
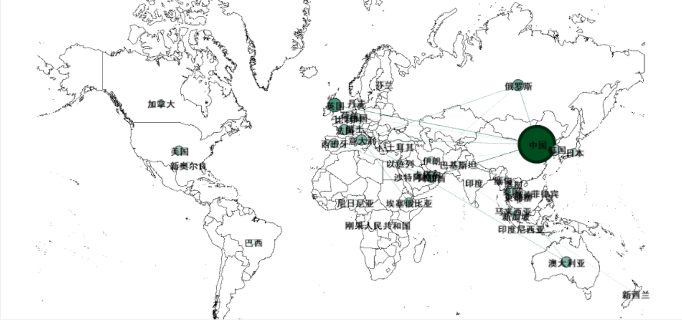
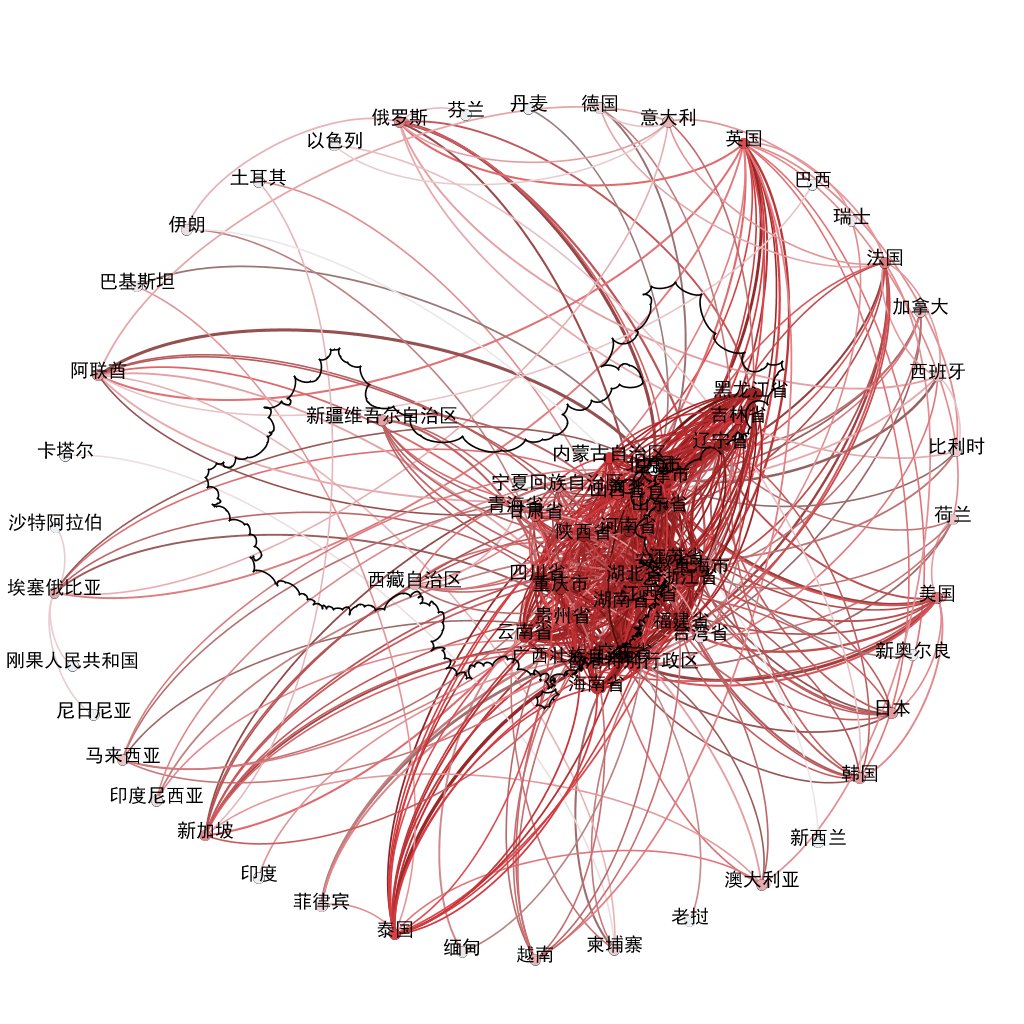
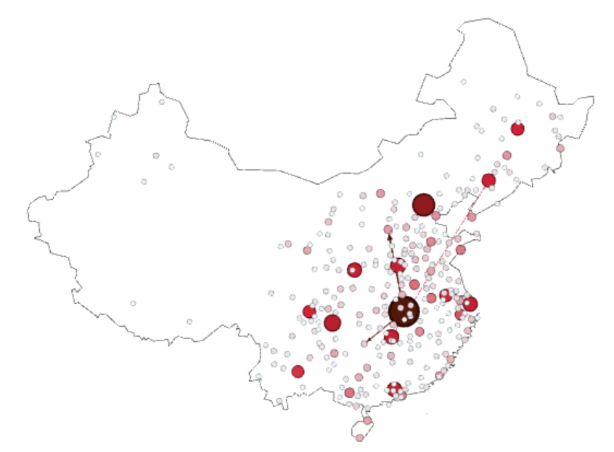
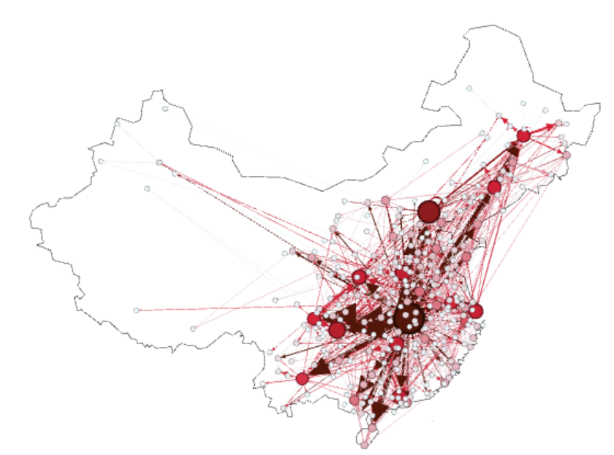
Under background perspective focus on China
- Circular layout
- Atlas layout
Dynamic figures
- Among China (province as unit)

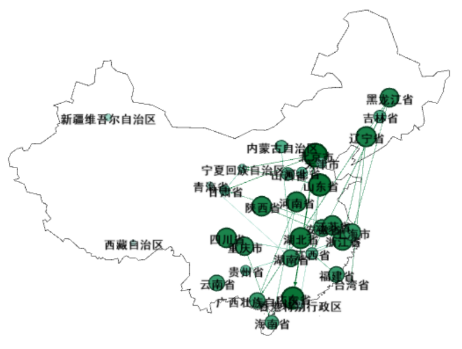
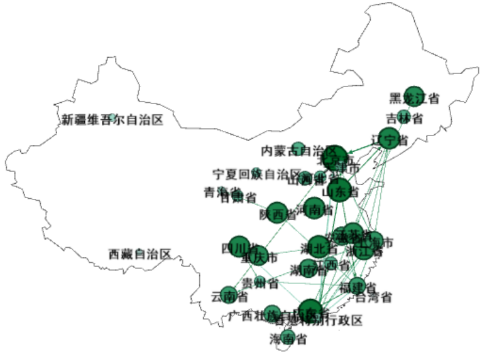
- Among China (city as unit)
- Whole world (country as unit)